Lindy Orthia and Rachel Morgain: Tips for effective #scicomm infographic
CPAS academic Lindy Orthia and NESP Threatened Species Recovery Hub knowledge broker Rachel Morgain have teamed up to create an infographic called 'Tips for effective #scicomm', published this month.
The infographic is aimed at anyone who wants to know more about the contextual factors that can make or break science communication efforts.
'Science communication is more than great charisma or fun writing,' said Dr Morgain. 'Context matters.'
The infographic captures five memory aid acronyms to help communicators brainstorm things they might need to consider to achieve their aims.
'Using mnemonics to summarise five different aspects of sci com will hopefully help people remember them so it becomes second nature,' said Dr Orthia.
So what are the five mnemonics?
Read on for the short version, download the infographic or click here for more detail...
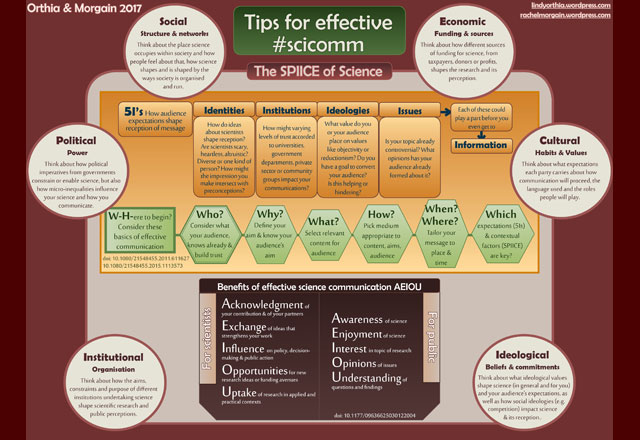
The 6Ws and 1H
The basics are captured with the '6Ws and 1H' mnemonic - reminding communicators to consider Who they're communicating with, Why they're doing it, What their key content is, How they can reach their audience, Where/When the communication is taking place, and Which other contextual factors they need to think about.
These key words are a classic mnemonic of science journalism. But as researchers in Australia and New Zealand recently found, they also sum up the most important things for any science communicators to consider - audience, aim, content, medium and context.
The 5 'I's
Audience expectations of science and scientists can have a huge impact on the effectiveness of science communication. The 5 'I's mnemonic helps communicators list five elements of science that might matter.
Preconceptions about the Identities of scientists, levels of trust in scientific Institutions, Ideological differences between scientists and others, and audience views on controversial science Issues can all have an impact on communication success, before even getting to the Information the communicator wants to convey.
'I developed the 5 'I's to help my students brainstorm the science content in popular fiction,' said Dr Orthia. 'But it's also useful for thinking about different dimensions of public perceptions of science in general.'
The SPIICE of Science
Science itself is shaped by contextual factors, impacting the research that gets done and which research is valued by society. That in turn has an impact on the big picture relationships between science and society, and from there on communication.
The SPIICE of science acronym helps communicators think through how this big picture might be relevant to their work: it stands for the Social, Political, Institutional, Ideological, Cultural and Economic elements of science.
Dr Orthia developed the acronym to help first year sci com students think about the broader contexts of science. She and Dr Morgain refined it for this infographic.
AEIOU x 2
There are potentially lots of reasons to engage in science communication, but busy scientists can need reminders of why it's a worthwhile use of their time.
In 2003, three researchers, including CPAS Professor Sue Stocklmayer, published an AEIOU mnemonic that captures some ideal public outcomes of science communication: it can raise people's Awareness of science, their Enjoyment of it, their Interest in particular topics, their Opinions about scientific issues and their Understanding of science questions and findings.
More recently, Dr Morgain developed another version of AEIOU that summarises some of the main benefits for scientists. These are Acknowledgement of partners and collaborators, the Exchange of ideas that can shape thinking, exerting Influence on policy and public action, creating new Opportunities for research funding, and promoting Uptake of research by the people who can use it.
The creators hope the infographic will prove useful to science communication students, teachers and practitioners alike.
Download the infographic here.